
ChartDirector
Question
Can I add a bar chart to my page using modifiable data in page markup?
Answer
This is a quick hack. I am using the Chart Director package from Advanced Software Engineering. Put the download ChartDirector directory under pub/ChartDirector in your pmwiki tree. Then place barchart.phpΔ into your cookbook directory. And finally, edit your config.php and add:
 Markup('chartdir','<include',
        "/\\(:chartdir\\s*(.*?):\\)/e",
        "chartDir('$1')");

 function commaURLEncode($items) {
        return implode(",",array_map("urlencode", explode(",",$items)));
 }

 function chartDir($opts) {
        $args = ParseArgs("$opts");

        $first=1;
        foreach ($args as $key => $value) {
                if ($key == "#") {
                        continue;
                }
                if ($first) {
                        $httpParam = "?";
                        $first=0;
                } else {
                        $httpParam = $httpParam."&";
                }
                $httpParam = $httpParam.$key."=".commaURLEncode($value);
        }
        # Replace localhost with your host.
        # You may have to locate barchart.php somewhere else depending on your policies.
        return "http://localhost/pmwiki/cookbook/barchart.php{$httpParam}&d=.png";
 }
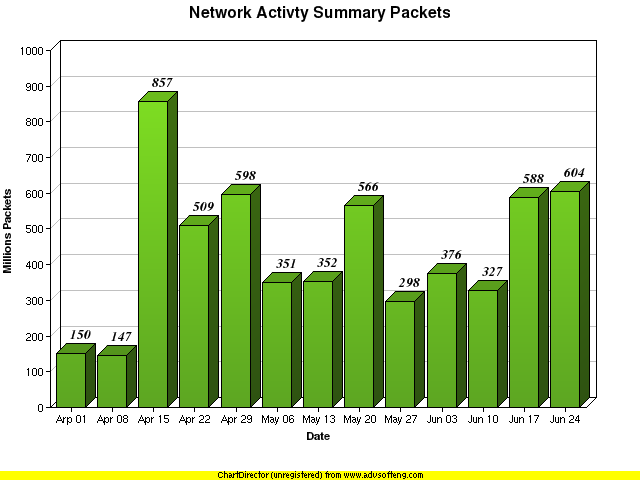
(:chartdir xaxis=Date yaxis='Millions Packets' title='Network Activty Summary Packets' data=150,147,857,509,598,351,352,566,298,376,327,588,604 x=640 y=480 3d=10 color=#77ee77 startcolor=#449944 labels='Apr 01,Apr 08,Apr 15,Apr 22,Apr 29,May 06,May 13,May 20,May 27,Jun 03,Jun 10,Jun 17,Jun 24':) |
(:chartdir xaxis=Date yaxis='Millions Packets' title='Network Activty Summary Packets' data=150,147,857,509,598,351,352,566,298,376,327,588,604 x=640 y=480 3d=10 color=#77ee77 startcolor=#449944 labels='Apr 01,Apr 08,Apr 15,Apr 22,Apr 29,May 06,May 13,May 20,May 27,Jun 03,Jun 10,Jun 17,Jun 24':) |
If it were enabled on this page, the markup example would show:
Notes
- This recipe was last tested on PmWiki version: pmwiki-2.0.beta37
See Also
Contributors
Comments
See discussion at ChartDirector-Talk